.png)

A recruiter can make forty calls, send sixty messages, screen a dozen candidates, and update every record in the ATS by end of day - and still close the month with zero placements. Any staffing leader who has run a desk for more than a quarter has seen this happen. The recruiter wasn't lazy. They were busy. Busy and productive are not the same thing, and confusing them is one of the most expensive measurement mistakes a staffing agency can make.
This is where recruiter productivity metrics earn their keep. Done well, they don't just tell you who's working hard. They tell you where time is turning into outcomes and where it's disappearing into activity that never converts. This article lays out a full scorecard framework - what to measure, how to calculate it, what the number actually means, and what to do when it's weak.
What Are Recruiter Productivity Metrics?
Recruiter productivity metrics measure how effectively a recruiter's time and effort convert into recruiting outcomes - submissions that lead to interviews, interviews that lead to offers, offers that lead to placements. They are not the same as activity counts.
Calls, emails, resumes reviewed, and screens completed are inputs. They matter, but on their own they don't tell you whether a recruiter's desk is healthy. Real productivity sits at the intersection of several things happening at once:
- Time - how many working hours a recruiter actually has available for recruiting work
- Workload - how many open requisitions and active candidates they're responsible for
- Activity - the sourcing, outreach, and screening work they perform
- Pipeline movement - how quickly candidates advance through stages
- Conversion - how efficiently that pipeline turns into interviews, offers, and placements
- Outcomes - placements, revenue, and gross profit generated
For a staffing agency, this matters more than it does for a typical internal TA function, because recruiter output is directly tied to revenue. A weak week on one desk isn't just a performance question - it's a pipeline and margin question. That's why a good scorecard has to connect activity all the way through to business outcomes, not stop at "did they do the work."
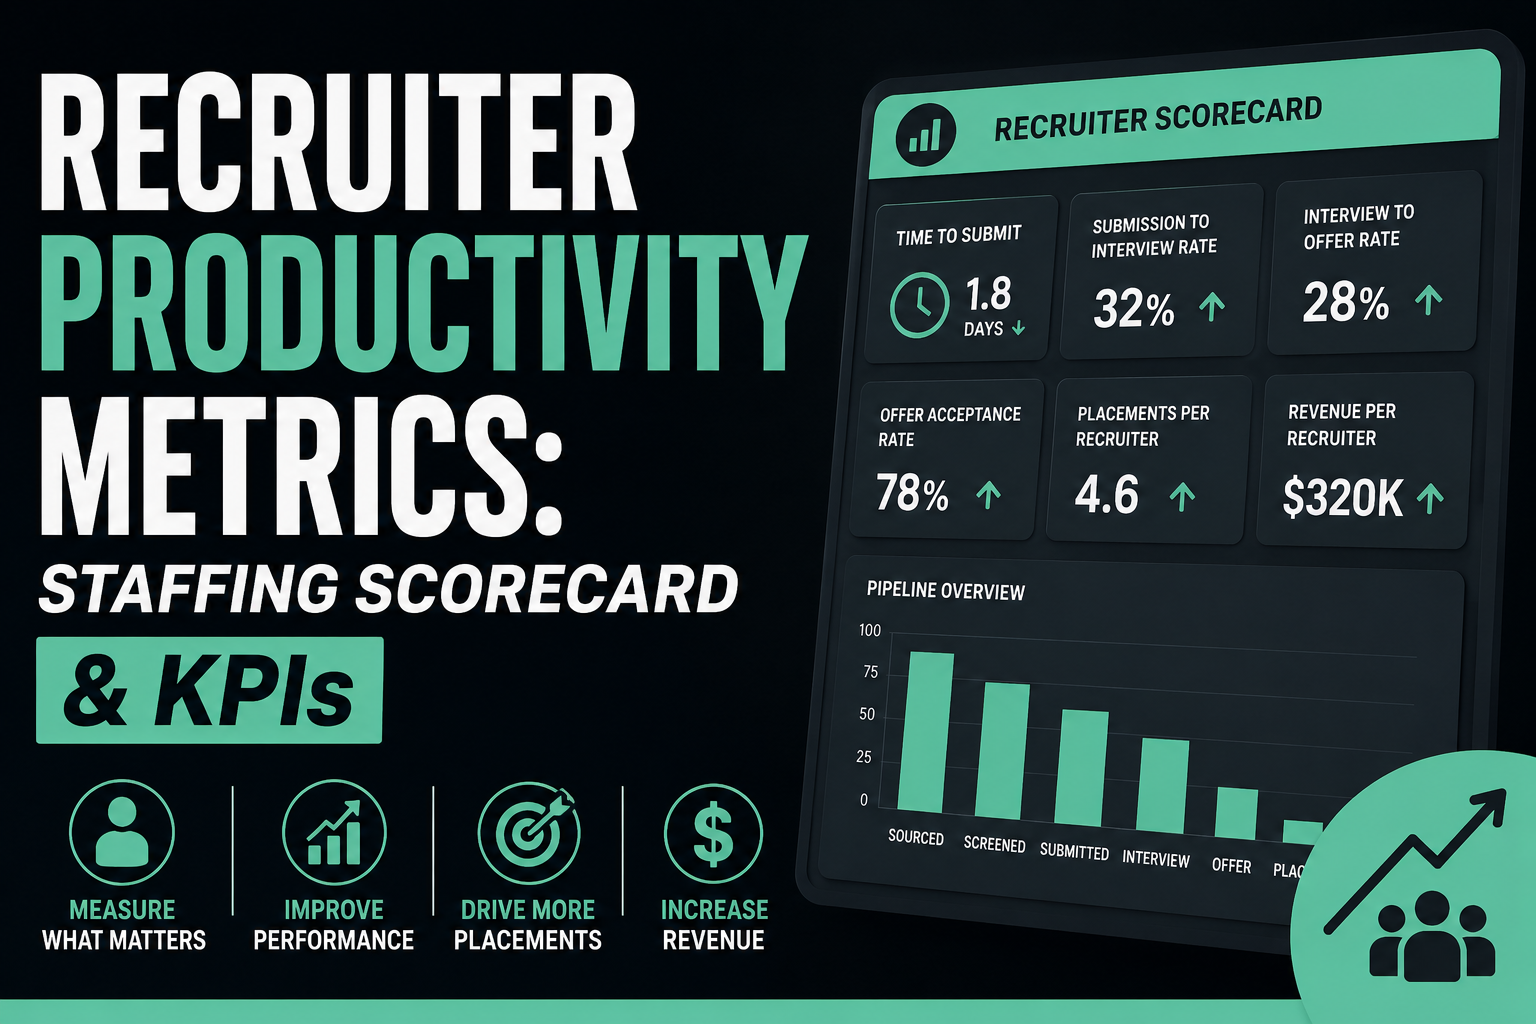
The Recruiter Productivity Scorecard
Below is the core scorecard. It's organized by category so you can see where in the funnel a metric sits, and what direction generally signals health - though as we'll cover later, "good" is always relative to your own baseline.
The 10 Recruiter Productivity Metrics That Matter
Each of these deserves more than a one-line definition. Here's what to calculate, why it matters, and what to do when the number looks off.
1. Time to First Submit
What it measures: How long it takes a recruiter to deliver the first qualified candidate on a new requisition.
Why it matters: Speed to first submit sets the tone for a requisition. Clients form early impressions of an agency based on how quickly they see relevant candidates.
Weak result may indicate: Poor intake clarity, sourcing bottlenecks, an overloaded recruiter, or a req that's genuinely difficult to fill.
What to investigate next: Check whether the delay is specific to one recruiter or shows up across the desk. If it's desk-wide, the intake process or sourcing tools are the likely culprit, not the people.
2. Submission-to-Interview Ratio
What it measures: The percentage of submitted candidates who get an interview.
Why it matters: This is one of the clearest signals of candidate-job fit. It tells you whether a recruiter is matching accurately or submitting volume hoping something sticks.
Weak result may indicate: Misalignment with the hiring manager's real criteria, resume presentation issues, or a recruiter submitting past screening rather than matching.
What to investigate next: Pull a sample of rejected submissions and look for a pattern - is it the same skill gap, the same comp mismatch, the same level miss?
3. Interview-to-Offer Ratio
What it measures: How often interviews turn into offers.
Why it matters: This reflects candidate preparation, positioning, and how well the recruiter reads what the client actually wants after the resume stage.
Weak result may indicate: Candidates aren't prepped for interviews, or there's a mismatch between what got them submitted and what the client evaluates live.
What to investigate next: Talk to hiring managers directly about why candidates aren't advancing. This is often a coaching gap, not a sourcing gap.
4. Offer Acceptance Rate
What it measures: The share of extended offers that candidates accept.
Why it matters: A low acceptance rate late in the funnel is expensive - it means work invested through interviews and negotiation evaporates.
Weak result may indicate: Compensation misalignment, counteroffers, slow offer turnaround, or candidates losing engagement during a long process.
What to investigate next: Look at time between final interview and offer. Delays here are a common, fixable cause.
5. Placements per Recruiter
What it measures: Total closed placements over a period, per recruiter.
Why it matters: It's the most direct output metric, but it should never be read alone - two recruiters can have identical placement counts with very different desk difficulty and margin.
Weak result may indicate: A breakdown anywhere upstream in the funnel, or a desk with unusually hard requisitions.
What to investigate next: Pair this metric with conversion ratios before drawing conclusions about the recruiter's skill.
6. Revenue per Recruiter
What it measures: Total billed revenue generated by a recruiter's placements.
Why it matters: This connects individual recruiter output directly to the business's top line.
Weak result may indicate: Lower-value placements, a slower desk, or a recruiter working smaller roles that still take full effort to close.
What to investigate next: Compare against placements per recruiter - low revenue with strong placement volume usually points to role mix, not effort.
7. Gross Profit per Recruiter
What it measures: Margin-adjusted contribution after pay rate or cost of placement.
Why it matters: Revenue alone can hide thin-margin placements. Gross profit tells you what's actually left for the business.
Weak result may indicate: Aggressive rate negotiation from clients, or a recruiter closing high-volume but low-margin roles.
What to investigate next: Segment by client and role type to see where margin is being given away.
8. Candidate Response Rate
What it measures: How many outreach attempts result in a candidate response.
Why it matters: A leading indicator of message quality, targeting accuracy, and market receptiveness.
Weak result may indicate: Generic messaging, poor targeting, saturated candidate pools, or reaching out at the wrong times.
What to investigate next: Test message personalization and channel - response rates often vary sharply by platform and role level.
9. Recruiter Admin Time
What it measures: The share of a recruiter's day spent on non-recruiting work - data entry, status updates, scheduling logistics.
Why it matters: This is the metric that explains "busy but not productive" more than any other. High admin time directly reduces available capacity for sourcing and candidate work.
Weak result may indicate: Manual ATS updates, disconnected tools, or a process that hasn't been automated where it easily could be.
What to investigate next: Map exactly where the hours go. This is usually a workflow and tooling problem, not a discipline problem.
10. Fill Rate
What it measures: The percentage of open requisitions that get successfully filled.
Why it matters: Fill rate is the client-facing scoreboard. It affects renewal decisions and how much of your pipeline clients trust you with.
Weak result may indicate: Client-side issues (unrealistic requirements, slow interview loops) as much as recruiter performance.
What to investigate next: Break fill rate down by client and role type before assuming it's a recruiter issue - some reqs are simply harder to fill than others.
None of these numbers mean much as a universal benchmark. A staffing model built on high-volume light industrial roles will have a different natural submission-to-interview ratio than an executive search desk. Role complexity, market conditions, client responsiveness, and whether a recruiter works contract or direct-hire searches all shift what "normal" looks like. The right move is building your own baseline and watching the trend, not chasing an industry number someone quoted in a blog post.
Activity Metrics vs Productivity Metrics
This distinction is where most scorecards go wrong. Activity metrics are useful - they're leading indicators of effort and pipeline. But they become misleading the moment they get treated as the definition of productivity.
Consider two recruiters on the same client. One sends thirty resumes and generates a single interview. The other sends eight candidates and generates three interviews. On an activity report, the first recruiter looks more productive - more submissions, more work logged. On a productivity scorecard, the second recruiter is clearly outperforming, because their time is converting at a much higher rate and the client is seeing better use of their attention.
Activity metrics still belong on the dashboard. They tell you where a recruiter is spending their hours and whether pipeline is being fed. The mistake is stopping there. Activity without conversion is motion without progress, and a scorecard that only counts motion will reward the wrong behavior.
Leading vs Lagging Recruiter Productivity Metrics
A complete scorecard needs both leading and lagging indicators. Leading indicators tell you what's likely to happen. Lagging indicators tell you what already did.
Lagging indicators are what leadership ultimately cares about - they show up on the P&L. But if you only watch lagging numbers, you find out about a problem after it's already cost you a placement. Leading indicators give you the chance to intervene mid-month instead of explaining a miss after the fact. A scorecard that includes both lets you manage forward, not just report backward.
How to Build a Recruiter Productivity Scorecard
Step 1: Define the business outcome. Start with what actually matters financially - placements, revenue, gross profit - and work backward from there. The scorecard exists to explain that number, not the other way around.
Step 2: Map the recruiting funnel. REQ to SOURCE to ENGAGE to SCREEN to SUBMIT to INTERVIEW to OFFER to PLACEMENT. Every metric on your scorecard should attach to one of these stages.
Step 3: Assign metrics to each stage. Sourcing gets qualified candidates sourced and response rate. Submission gets time to submit and submission-to-interview. Offer gets acceptance rate. Don't let stages go unmeasured, and don't stack five metrics onto one stage while another has none.
Step 4: Separate leading and lagging indicators. Label them explicitly on the dashboard. This prevents managers from reacting to a lagging number as if it were something they could fix today.
Step 5: Establish internal baselines. Pull the last two or three quarters of your own data by desk, role type, and recruiter tenure. This is your reference point - not a number from a blog post or a competitor's case study.
Step 6: Review trends instead of isolated numbers. One bad week rarely means anything. A metric drifting the wrong way for three or four consecutive weeks is worth a conversation.
Step 7: Add context for recruiter workload and desk complexity. A recruiter carrying twelve open reqs on niche technical roles should not be scored against a recruiter running six high-volume light industrial reqs with the same yardstick. Recruiter capacity planning should feed directly into how you interpret every number on the scorecard.
What Should a Recruiter KPI Dashboard Include?
Not every metric belongs in front of every person. A staffing KPI dashboard works best when it's built around who's using it and what decision they need to make with it.
Daily Recruiter View
- Active requisitions
- Candidates requiring action today
- Overdue follow-ups
- Interviews scheduled today
- Submissions awaiting client feedback
- Pipeline movement since yesterday
Weekly Recruiting Manager View
- Time to submit, by recruiter
- Submission-to-interview ratio
- Interview-to-offer ratio
- Offer acceptance rate
- Placements closed this week
- Recruiter capacity across the team
- Pipeline health by requisition
Monthly Executive View
- Total placements
- Revenue per recruiter
- Gross profit per recruiter
- Fill rate
- Pipeline health across the business
- Recruiter capacity trends
- Operational efficiency (admin time vs recruiting time)
A recruiter checking daily follow-ups doesn't need quarterly gross profit in front of them, and an executive reviewing monthly performance doesn't need to see every candidate action from yesterday. Matching the view to the role keeps each dashboard useful instead of overwhelming, and it's a core part of addressing the broader staffing agency productivity picture rather than just recruiter-level noise.
Recruiter Productivity Scorecard Template
Use this as a starting structure. Targets should come from your own historical performance, segmented by desk type - not from a generic number.
How to Diagnose a Recruiter Productivity Problem
This is where the scorecard stops being a report card and starts being a diagnostic tool. Each pattern below points to a different place to look.
High activity + low submissions
The recruiter is putting in hours but not converting sourcing into qualified candidates. This often points to weak targeting, unclear intake criteria, or a talent pool that's already been worked hard by other recruiters or competitors.
High submissions + low interviews
Volume is there but candidates aren't landing. Look at whether the recruiter is matching against the actual role or against a loose interpretation of it. Client-side, check whether the hiring manager's stated requirements match what they're really screening for.
High interviews + low offers
Candidates are getting in the door but not closing. This is frequently an interview-prep gap - candidates walking in without a clear sense of what the client evaluates, or without positioning that addresses likely objections.
High offers + low placements
Offers are being extended but not accepted. Look at speed between final interview and offer, competitiveness of the offer itself, and whether candidates are staying engaged with the recruiter through that gap. Counteroffers and competing processes often surface here.
Good conversion + low recruiter output
Everything converts well, but total output is still low. This usually isn't a skill problem - it's a capacity problem. The recruiter may be carrying too few active reqs, or spending disproportionate time on one difficult search.
Good output + excessive admin time
The recruiter is closing deals but their admin time is eating into hours that could go toward more reqs. This is a workflow and tooling question, not a people question, and it's usually the clearest automation opportunity on the scorecard.
The point of all six patterns is the same: the metric on its own rarely tells the full story. It tells you where to go look next.
Why Recruiters Can Look Busy Without Being Productive
Most staffing desks aren't slow because recruiters aren't trying. They're slow because the workflow is fragmented. A typical day can involve switching between an ATS, a sourcing tool, email, a scheduling tool, a texting platform, and a spreadsheet someone built two years ago to track something the ATS doesn't handle well.
Each switch has a small cost. Updating a candidate's status in three different places. Re-typing information the recruiter already collected once. Manually chasing a hiring manager for feedback that should have triggered automatically. None of these tasks are hard. Together, they're what quietly consumes a recruiter's day and shows up as high admin time on the scorecard.
This is also where recruiting software overload becomes a real productivity drag rather than an abstract complaint. Adding more point solutions to a recruiter's stack doesn't automatically add capacity - sometimes it does the opposite, because every new tool is another place data has to be re-entered and another context switch.
Recruiter capacity isn't just a headcount question. It's a question of how much of a recruiter's actual working time is available for recruiting - sourcing, engaging candidates, managing client relationships - versus how much gets absorbed by the mechanics of the process itself.
How AI and Automation Can Improve Recruiter Productivity
"AI makes recruiters more productive" isn't a useful claim on its own. The useful question is which specific bottleneck a piece of automation removes, and which metric on the scorecard should move as a result.
The real test of any automation isn't whether it carries an AI label. It's whether the relevant number on the scorecard actually moves after you turn it on. If admin time doesn't drop, or submission-to-interview doesn't improve, the tool isn't doing its job regardless of what it's marketed as.
Turn Your Productivity Scorecard Into More Recruiting Capacity
A scorecard is diagnostic - it shows you exactly where recruiter time is being lost to work that doesn't require human judgment: manual sourcing, repetitive outreach, first-pass screening, chasing status updates. Once you can see it, the next step is removing it.
NinjaHire's AI recruiting platform is built to take that repetitive work off a recruiter's plate so their time goes back into sourcing, candidate conversations, and closing - the parts of the job the scorecard actually rewards.
What Should Change After Automating Recruiting Work?
Rather than promising a specific percentage lift, it's more useful to know what direction each part of the scorecard should move if automation is actually working:
- Admin hours - down
- Time to first submit - down
- Recruiter capacity - up
- Qualified candidate volume - up
- Candidate response rate - up
- Pipeline movement - up
- Placements per recruiter - up
These are directional expectations, not guarantees. The actual size of the shift depends on your desk mix, your recruiters' starting workflows, and how deeply the automation is integrated into daily work rather than bolted on as an extra step. The goal of automating recruiting work is to create more usable recruiting capacity - not to add another tool that recruiters have to manage on top of everything else.
Common Mistakes Staffing Leaders Make When Measuring Recruiter Productivity
1. Measuring calls instead of outcomes. Call volume is easy to track and easy to game. It rarely tells you whether the calls led anywhere.
2. Giving every recruiter the same target. A recruiter on a niche technical desk and one on high-volume light industrial roles should not share a placements-per-month target.
3. Comparing different desks directly. Direct-hire and contract desks, or junior and senior recruiters, produce naturally different numbers. Comparing them head-to-head invites the wrong conclusions.
4. Tracking too many KPIs. A dashboard with thirty metrics doesn't drive better decisions - it just makes every metric easier to ignore.
5. Ignoring recruiter capacity. A recruiter's output can't be read fairly without knowing how many open reqs and active candidates they're carrying at the same time.
6. Ignoring client-side bottlenecks. Slow interview loops or unrealistic requirements can tank a recruiter's conversion numbers through no fault of their own.
7. Treating one bad week as a trend. Recruiting is lumpy by nature. A single weak week rarely means anything on its own.
8. Using metrics as punishment rather than diagnosis. A scorecard used only to call out underperformance loses its value as a tool for actually improving the desk.
9. Measuring revenue without quality. Chasing revenue alone can quietly encourage recruiters to push weaker candidates through just to close the deal.
10. Automating without measuring before-and-after performance. Without a baseline, there's no way to know whether new tooling actually helped or just changed where the time went.
How Many Recruiter KPIs Should a Staffing Agency Track?
A practical scorecard can start with roughly 8 to 12 meaningful metrics that span capacity, activity, speed, quality, conversion, output, and financial performance. That's usually enough to see the full picture without drowning managers in numbers nobody reviews consistently.
Tracking dozens of KPIs feels thorough, but in practice it creates noise. Managers stop reviewing dashboards that are too dense, and important signals get buried next to metrics that don't drive any decision. A shorter, well-chosen scorecard that people actually check every week beats a comprehensive one that gets opened once a quarter.
The Recruiter Productivity Scorecard: A Practical Operating Model
This flow is the operating model behind everything above it. Capacity determines how much activity is even possible. Activity feeds speed and quality. Speed and quality drive conversion. Conversion produces placements, and placements produce revenue and gross profit. A weakness anywhere in that chain shows up downstream, which is exactly why isolated metrics mislead and a connected scorecard doesn't.
The shift this creates for a staffing leader is simple to state and harder to practice: stop asking "what are recruiters doing?" and start asking "where is recruiting capacity being consumed, and what outcomes is that time producing?" The first question generates activity reports. The second one generates decisions.
Frequently Asked Questions
What are the most important recruiter productivity metrics?
The most important metrics span the full funnel rather than one stage: time to first submit, submission-to-interview ratio, interview-to-offer ratio, offer acceptance rate, placements per recruiter, revenue and gross profit per recruiter, and admin time. Together they show whether a recruiter's time is converting into outcomes, not just producing activity.
How do you measure recruiter productivity?
You measure it by connecting time, workload, and activity to pipeline movement and outcomes - not by counting calls or emails alone. A recruiter is productive when their available capacity converts efficiently through sourcing, submissions, interviews, offers, and placements, and that conversion is trended over time against their own baseline.
What KPIs should staffing agencies track for recruiters?
A practical set covers capacity (active requisitions), activity (qualified candidates sourced), speed (time to submit), quality (submission-to-interview ratio), conversion (interview-to-offer, offer acceptance), output (placements), and financial performance (revenue and gross profit per recruiter). Around 8 to 12 metrics is usually enough.
What should be included in a recruiter productivity scorecard?
A scorecard should include metrics mapped to every stage of the recruiting funnel, a mix of leading and lagging indicators, and context for recruiter capacity and desk complexity. It should show what's happening now (leading indicators) and what already happened (lagging indicators), not just one or the other.
What should a recruiter KPI dashboard include?
It depends on the audience. Recruiters need a daily operational view of active tasks and follow-ups. Managers need a weekly view of conversion ratios and capacity. Executives need a monthly view of placements, revenue, gross profit, and fill rate. One dashboard trying to serve all three usually serves none of them well.
How can AI improve recruiter productivity?
AI can reduce time spent on manual sourcing, repetitive outreach, first-pass screening, and scheduling - work that consumes hours without requiring recruiter judgment. The measure of whether it's actually helping isn't the technology label; it's whether metrics like admin time, time to submit, and submission-to-interview ratio move in the right direction afterward.