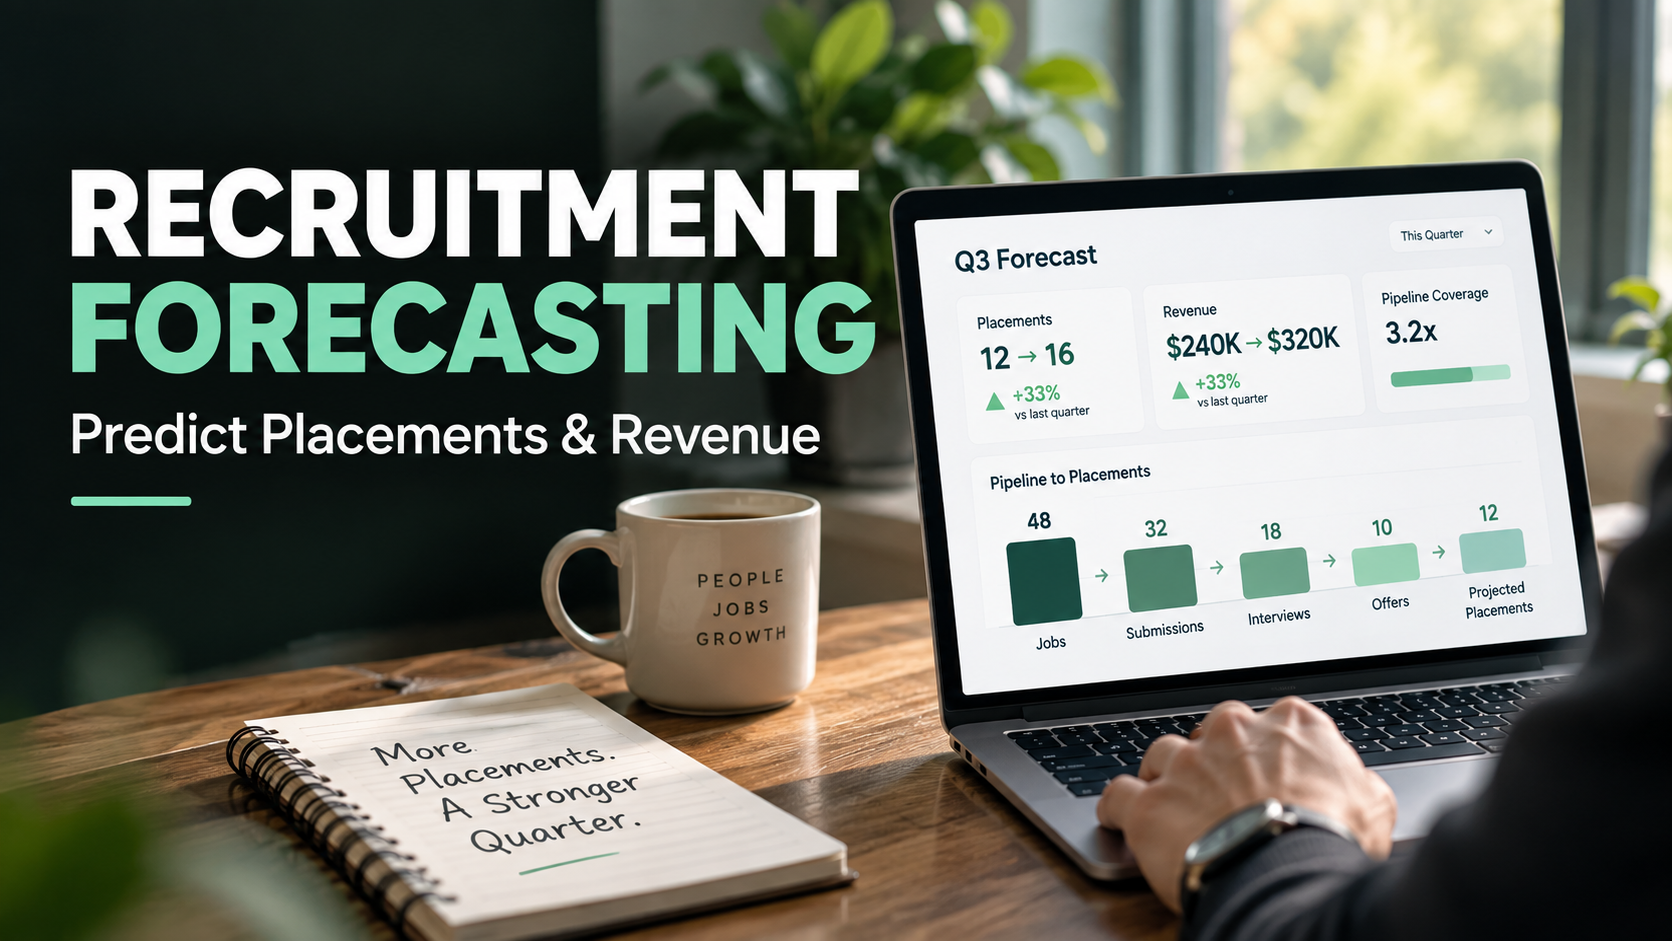
Most staffing leaders can tell you exactly how many requisitions are open right now. Fewer can tell you, with any real confidence, how many of those requisitions will actually turn into placements before the quarter closes. That gap between activity and outcome is where a lot of quarter-end scrambling comes from.
An open requisition is not a placement. A qualified candidate in the pipeline is not a placement. A submission is not an interview, an interview is not an offer, and an offer is not a start. Every one of those stages carries its own drop-off, and if you have run a desk for any length of time, you already know that pipeline volume and pipeline quality are not the same thing.
This is what recruitment forecasting is for. Done well, it connects the stages in your pipeline to how those stages have historically converted, how long they typically take to move, and what each closed placement is actually worth. That combination is what turns a list of open jobs into a number you can plan around.
Two formulas sit underneath almost everything in this article, and it is worth stating them plainly up front:
Expected Placements = Qualified Pipeline × Stage Conversion Probability
Forecasted Revenue = Expected Placements × Average Placement Value
These are planning formulas, not universal industry benchmarks. The probabilities and averages that go into them will come from your own desk, your own clients, and your own history. What matters is having a consistent, defensible way to turn pipeline data into an honest answer to the question every staffing leader eventually has to answer out loud: how many placements are we actually going to close, and what is that worth in revenue?
What Is Recruitment Forecasting?
Recruitment forecasting is the practice of estimating future recruiting outcomes, such as placements or revenue, based on current pipeline activity and historical conversion patterns. Rather than simply reporting what has already happened, it uses that history to project what is likely to happen next within a defined period, such as the current quarter.
Recruitment forecasting matters because staffing is a business built on timing. A client does not care how many candidates are in your pipeline; they care whether a role gets filled. A finance team does not care how many interviews happened last week; they care whether revenue lands this quarter. Forecasting is the bridge between recruiting activity and the business decisions that depend on it, from recruiter staffing to client commitments to cash flow planning.
It is worth distinguishing recruitment forecasting from a few adjacent terms that get used loosely.
| Concept |
What It Predicts |
| Recruitment forecasting | Future recruiting outcomes |
| Headcount planning | Future workforce requirements |
| Capacity planning | Recruiter or team ability to handle demand |
| Placement forecasting | Expected staffing placements |
| Revenue forecasting | Expected financial outcome |
Recruitment forecasting sits above the others in one sense: it is the discipline that pulls demand, pipeline, and recruiter capacity together into a single estimate of what is coming. Placement and revenue forecasting are really the practical output of that work for a staffing business.
What Should a Staffing Agency Forecast?
A staffing agency needs more than a hiring demand estimate. Because the business model is built on placements and fees, forecasting has to run all the way through the funnel, from new job orders to gross profit.
| Forecast |
What It Helps Predict |
| New job orders | Future demand |
| Active requisitions | Current delivery workload |
| Candidate submissions | Pipeline movement |
| Interviews | Near-term conversion |
| Offers | Late-stage opportunities |
| Placements | Expected closes |
| Placement revenue | Expected commercial outcome |
| Gross profit | Expected profitability |
| Recruiter capacity | Ability to deliver the forecast |
That last row matters more than it looks. A forecast that assumes placements will close without checking whether recruiters have the bandwidth to actually work those requisitions is not a forecast, it is a wish list. Staffing agency forecasting only holds up when demand, pipeline, and delivery capacity are considered together, which is why it is worth reading alongside how you think about staffing agency capacity planning.
How Recruitment Forecasting Works
Recruitment forecasting works by starting with what has already happened, applying that pattern to what is currently in the pipeline, and adjusting for timing so the estimate reflects a specific period rather than an open-ended eventuality. In practice, that breaks down into six steps.
Step 1: Start With Historical Placement Data
Before you can estimate what is coming, you need a clear picture of what has already closed. That means pulling placements by month or quarter, requisitions received, submissions, interviews, offers, offer acceptance, time to fill, and average placement value. This is the raw material every forecast is built from, and it is the same underlying data that feeds recruitment analytics, just used for a different purpose. Where analytics looks backward to explain performance, forecasting uses that same history to look forward.
Step 2: Segment the Historical Data
One conversion rate for the whole agency is rarely useful. A healthcare desk, an IT desk, a light industrial desk, an executive search practice, and a contract staffing line all behave differently, with different time to fill, different offer dynamics, and different placement values. Blend them together and you get a number that does not represent any of them accurately. Segment by desk, role type, client, or placement model wherever you have enough historical volume to make the comparison meaningful, and only combine categories when the underlying behavior is genuinely similar.
Step 3: Map the Current Pipeline
With historical patterns in hand, lay out exactly what is in the pipeline right now, stage by stage. A simple version might look like this:
100 active requisitions
↓
60 actively worked
↓
35 with qualified candidates
↓
20 submitted
↓
12 interviewing
↓
6 at offer stage
↓
4 highly likely placements
This kind of breakdown does more than sit in a report. It shows immediately that of 100 open requisitions, only a fraction have progressed far enough to be considered near-term opportunities. That gap between open and likely is exactly what a forecast is meant to capture, and exactly what gets missed when people talk about pipeline in terms of headcount alone.
Step 4: Apply Historical Conversion
Once the pipeline is mapped, apply your historical conversion rates to each stage. If comparable final interviews have converted to placement around 30 percent of the time historically, that is the assumption you carry forward, not a guarantee that every final interview in front of you right now will close. Probability is an estimate built from pattern, not a certainty attached to any single opportunity. Treating it as certainty is one of the fastest ways to end a quarter disappointed.
Step 5: Apply Timing
This step is the one most forecasts skip, and it is the one that matters most if you are trying to predict what closes before the quarter ends. A highly probable placement is not automatically a placement that lands this quarter. Forecasting for a specific period requires probability and timing together, not probability alone.
To apply timing accurately, look at days in stage, expected start date, how quickly the client has historically responded at each stage, historical time to fill for comparable roles, how offers have typically played out, and notice periods where relevant. An opportunity with strong probability but a start date two months past quarter end simply does not belong in this quarter's number, no matter how good it looks on paper.
Step 6: Convert Expected Placements Into Revenue
The final step ties the forecast back to the number finance actually cares about. Multiply expected placements by expected placement value to arrive at forecasted revenue. This is the same logic laid out in the introduction, applied now to the specific opportunities you have mapped and weighted.
How to Forecast Placements Before the Quarter Ends
The practical way to organize this work is a simple ladder, sorted by confidence, that most staffing leaders will recognize even if they have never written it down.
Tier 1: Committed
A late-stage opportunity with strong evidence of closing, such as an accepted offer with a confirmed start date. These are the placements you would be comfortable telling your finance team about by name.
Tier 2: Probable
Strong pipeline movement, such as a final interview or a pending offer, but with meaningful uncertainty still attached. These deserve weight in the forecast, not full credit.
Tier 3: Possible
Earlier pipeline activity, such as a first-round interview, where the opportunity is real but confidence is lower. These belong in an upside view more than a core number.
Tier 4: Pipeline Only
Open requisitions or early submissions with no meaningful movement yet. Track them, but it is too early to include them in the core forecast.
Applying probability to each opportunity individually, rather than treating the whole pipeline as one bucket, is what makes the ladder useful. A simple example:
| Opportunity |
Stage |
Probability |
Expected Placement |
| Job A | Offer accepted | 90% | 0.90 |
| Job B | Final interview | 60% | 0.60 |
| Job C | Client interview | 40% | 0.40 |
| Job D | Submitted | 20% | 0.20 |
Add the expected placement column and you get a weighted placement forecast of 2.10 across these four opportunities, rather than four undifferentiated open jobs. The probabilities used here are illustrative only, not industry standards. Every staffing agency should calibrate its own probability assumptions against its own historical conversion data by stage.
Timing still governs the final answer. A job at final interview with a strong probability of closing is not part of this quarter's forecast if the realistic start date falls after the quarter ends. Probability tells you how likely something is to happen. Timing tells you whether it happens in the window you are actually forecasting for.
Recruitment Forecasting Formula
Four formulas cover most of what a staffing leader needs for a working recruitment forecasting model.
Weighted Placements = Sum of Opportunity Probability
If four opportunities carry probabilities of 0.90, 0.60, 0.40, and 0.20, weighted placements equal 2.10. This is the core number behind a probability-weighted forecast.
Forecasted Revenue = Weighted Placements × Average Placement Value
Multiply weighted placements by the average value of a placement in that segment to translate the placement forecast into a revenue estimate.
Forecast Accuracy = 1 − |Forecast − Actual| ÷ Actual
This tells you how close a past forecast landed to what actually happened. It is far more useful reviewed across several quarters than judged from a single one, since any individual period can be skewed by one large deal or one lost client.
Pipeline Coverage = Weighted Pipeline ÷ Revenue Target
This ratio tells you whether the weighted pipeline is even large enough to reach the target you are being held to. A coverage ratio well below 1.0 is an early warning that more demand needs to enter the pipeline, not just that existing opportunities need to move faster.
What Data Do You Need for an Accurate Recruitment Forecast?
An accurate forecast depends on five categories of data working together. Weakness in any one of them shows up as a shaky recruitment forecasting model, no matter how good the formulas are.
Historical data: placements, time to fill, conversion rates, average fee, and average revenue per placement.
Current pipeline: active requisitions, candidate submissions, interviews, offers, and candidate status at each stage.
Timing data: days in stage, expected start date, client response time, and historical time to fill for comparable roles.
Commercial data: fee or billing rate, expected revenue, gross margin, and client or job value.
Capacity data: recruiter workload, recruiter capacity, and active requisitions per recruiter.
Poor data in any of these categories does not just weaken the forecast, it quietly changes what the forecast is actually measuring. Missing timing data turns a probability estimate into a guess about when. Missing capacity data lets a forecast promise more placements than recruiters can physically deliver. The forecast is only as trustworthy as the inputs feeding it.
Recruitment Forecasting vs. Pipeline Reporting
These two get treated as interchangeable more often than they should be, and the difference matters for how a leadership team uses the numbers.
| Pipeline Reporting |
Forecasting |
| What exists now | What is likely to happen |
| Current candidates | Expected placements |
| Current requisitions | Expected fills |
| Historical activity | Forward-looking probability |
| Descriptive | Predictive |
Analytics tell you what happened. Forecasting uses that information to estimate what is likely to happen next. A strong recruitment analytics setup is what makes forecasting possible in the first place, since you cannot weight probabilities you have never measured. But a dashboard showing current pipeline volume, on its own, will not answer the quarter-end question. That requires the extra layer of conversion, probability, and timing laid out above.
Build a Recruitment Forecasting Template
A forecast is only useful if you can update it as the pipeline changes. The template below shows how a staffing team can connect each active opportunity to its stage, probability of placement, expected placement value, and quarter. The figures are illustrative so you can see how the calculation works. In a real recruitment forecasting model, the probability and placement value should come from your own historical data.
Placement Forecast Template
How to read the example: Expected Placement is calculated as the probability of placement for each opportunity. Expected Revenue is calculated as Expected Placement multiplied by the expected placement value for that job.
| Job |
Stage |
Days Open |
Probability |
Expected Placement |
Expected Revenue |
Quarter |
| Job A |
Offer |
10 |
90% |
0.90 |
$16,200 |
Q3 2026 |
| Job B |
Final Interview |
20 |
60% |
0.60 |
$9,000 |
Q3 2026 |
| Job C |
Client Interview |
12 |
40% |
0.40 |
$6,400 |
Q3 2026 |
| Job D |
Submitted |
8 |
20% |
0.20 |
$2,800 |
Q3 2026 |
| Job E |
Offer |
6 |
80% |
0.80 |
$16,000 |
Q3 2026 |
| Job F |
Interview |
15 |
50% |
0.50 |
$6,000 |
Q3 2026 |
| Job G |
Submitted |
18 |
25% |
0.25 |
$4,250 |
Q3 2026 |
| Job H |
Final Interview |
7 |
70% |
0.70 |
$10,850 |
Q3 2026 |
In this example, the eight opportunities represent a total weighted placement forecast of 4.35 placements. The expected revenue is $71,500. Those figures come directly from the probability assigned to each opportunity and its expected placement value, rather than treating every open requisition as an equally likely placement.
Example calculation:
Job B has a 60% probability of placement and an expected placement value of $15,000.
Expected Placement = 1 × 60% = 0.60
Expected Revenue = 0.60 × $15,000 = $9,000
The same calculation is applied to each opportunity. The probability should not be copied from a generic industry benchmark. It should reflect your agency's historical conversion data and the current stage, timing, client behavior, and quality of the opportunity.
Forecast Summary
A single forecast number can create false confidence. A better recruitment forecasting model gives leadership a range. The following example uses three scenarios to show how the same pipeline can support conservative, expected, and upside planning.
| Metric |
Conservative |
Expected |
Upside |
| Placements |
2.40 |
4.35 |
6.00 |
| Revenue |
$43,050 |
$71,500 |
$117,050 |
| Gross Profit |
$10,763 |
$17,875 |
$29,263 |
Scenario assumptions for this example:
Conservative includes the three high-confidence opportunities at 70% probability or above.
Expected uses the probability-weighted value of all eight opportunities.
Upside assumes the three high-confidence opportunities close, the two 50% to 60% opportunities close, and 50% of the remaining five lower-confidence opportunities convert.
Gross profit uses an illustrative 25% gross margin assumption. This is an example only and should be replaced with your agency's actual margin.
Used in a regular forecast review, this template does two jobs at once. The detail table shows exactly which opportunities are driving the forecast, so a recruiter can explain what has changed since the previous review. The summary gives leadership a realistic range for planning instead of a single number that suggests more precision than the pipeline supports.
The most important part is not the spreadsheet itself. It is the discipline of updating the assumptions as opportunities move through the recruiting process. A final interview that becomes an offer should have a different forecast value. A delayed client decision may reduce the likelihood of a quarter-end placement even when the underlying opportunity remains strong.
Build Conservative, Expected and Upside Forecasts
A single-number forecast tends to invite false confidence in one direction or the other. Building three scenarios instead gives a more honest picture of the range you are actually working with.
Conservative counts only the opportunities with the strongest evidence of closing, typically Tier 1 and the strongest of Tier 2. This is the number you would be comfortable being held to even if several deals slip.
Expected uses the full probability-weighted pipeline as described above, blending Tiers 1 through 3 according to their calibrated probabilities.
Upside adds realistic additional conversion from earlier-stage pipeline and reasonable movement on opportunities not yet fully weighted, without inventing volume that is not actually in the pipeline.
None of these scenario names are unique to any one methodology; staffing and sales organizations have used some version of this range for a long time. What matters is using them consistently, so that a hiring decision, a recruiter staffing plan, or a cash flow projection can be built against the conservative number while the expected number is what gets communicated as the working target.
How to Forecast Recruitment Revenue
Placement forecasting and revenue forecasting are closely related but not identical, because the commercial model behind each placement changes what revenue actually looks like.
Expected Revenue = Expected Placements × Average Placement Revenue
Permanent Placement
Revenue is generally expected placements multiplied by the average placement fee for that role type or client agreement.
Contract Staffing
Revenue depends on expected starts multiplied by expected billable margin and expected assignment duration, since revenue accrues over the length of the contract rather than at the moment of placement.
Retained Search
Revenue is typically tied to expected milestone payments multiplied by the probability of reaching each milestone, since fees are often collected in stages rather than only on completion.
The exact revenue model depends entirely on your firm's commercial structure, and the specific fee percentages, margins, and durations that apply to your business are not something that can be generalized from one agency to another. Build the formula around your own contract terms rather than an assumed average.
How Accurate Should a Recruitment Forecast Be?
Recruitment forecast accuracy depends on pipeline maturity, historical data quality, role consistency, client behavior, and how far out the forecast reaches, and there is no single accuracy percentage that applies universally across staffing agencies.
Accuracy is also not the same across every time horizon. A forecast for what closes in the next two weeks can be checked against opportunities already deep in the pipeline, so confidence tends to be higher. A quarter-end forecast has to account for opportunities still moving through earlier stages, so confidence is moderate. A forecast reaching a full quarter or more into the future carries the widest uncertainty, because more can change between now and then, from client budget shifts to candidate availability.
The factors that most affect accuracy in practice are pipeline maturity, the quality and consistency of your historical data, how comparable the roles being forecast actually are to each other, how predictable your client base has historically been, which placement model is involved, and how well your timing assumptions hold up against actual client response patterns. Improving any one of these tends to improve forecast reliability more than adjusting the formula itself.
Why Recruitment Forecasts Go Wrong
Most forecasting problems come from a small set of recurring habits, most of which are easy to spot once you know to look for them.
Counting every open requisition. Open does not mean fillable. A requisition with no active candidates in motion tells you almost nothing about what will close this quarter.
Treating every candidate equally. Submitted does not mean interviewed, and interviewed does not mean close to an offer. Each stage carries a different probability, and collapsing them into one bucket erases the information that makes forecasting useful.
Ignoring timing. A likely placement that lands next quarter does not help this quarter's number, no matter how confident the recruiter is about it.
Using one conversion rate for every desk. Different markets, role types, and placement models behave differently, and a blended average hides that variation instead of accounting for it.
Forecasting from activity. More calls or more submissions do not automatically translate into more placements. Activity is an input to the pipeline, not a substitute for pipeline quality.
Overweighting recruiter estimates. A recruiter's read on a deal is valuable context, but it should be balanced against historical evidence rather than taken as the whole picture. Optimism bias on individual opportunities adds up quickly across a full desk.
Ignoring pipeline aging. An opportunity that has been stuck in the same stage for weeks should carry a different probability than one that entered that stage yesterday, even if both show up identically on a stage report.
Not updating the forecast. A forecast built once at the start of the quarter and never revisited stops reflecting reality within days. Pipeline conditions change constantly, and the forecast needs to move with them.
How Often Should Staffing Agencies Update Their Forecast?
Most staffing agencies benefit from reviewing their forecast regularly throughout an active quarter, updating it further whenever a significant pipeline event occurs, rather than treating forecasting as a one-time exercise at the start of the period.
A weekly review often works well for an active pipeline, since it is frequent enough to catch meaningful movement without turning forecasting into a daily distraction. That said, weekly is a practical cadence rather than a fixed industry rule, and some desks with faster-moving roles may need more frequent checks while others may need less.
Between scheduled reviews, certain events should trigger an immediate update regardless of the calendar: a new job order entering the pipeline, a submission, an interview, an offer, a withdrawal, a start, a change in client priorities, an opportunity aging past its normal window, or a major shift in an expected start date. Any of these can move the forecast enough that waiting for the next scheduled review would leave leadership working from a stale number.
Recruitment Forecasting Metrics to Track
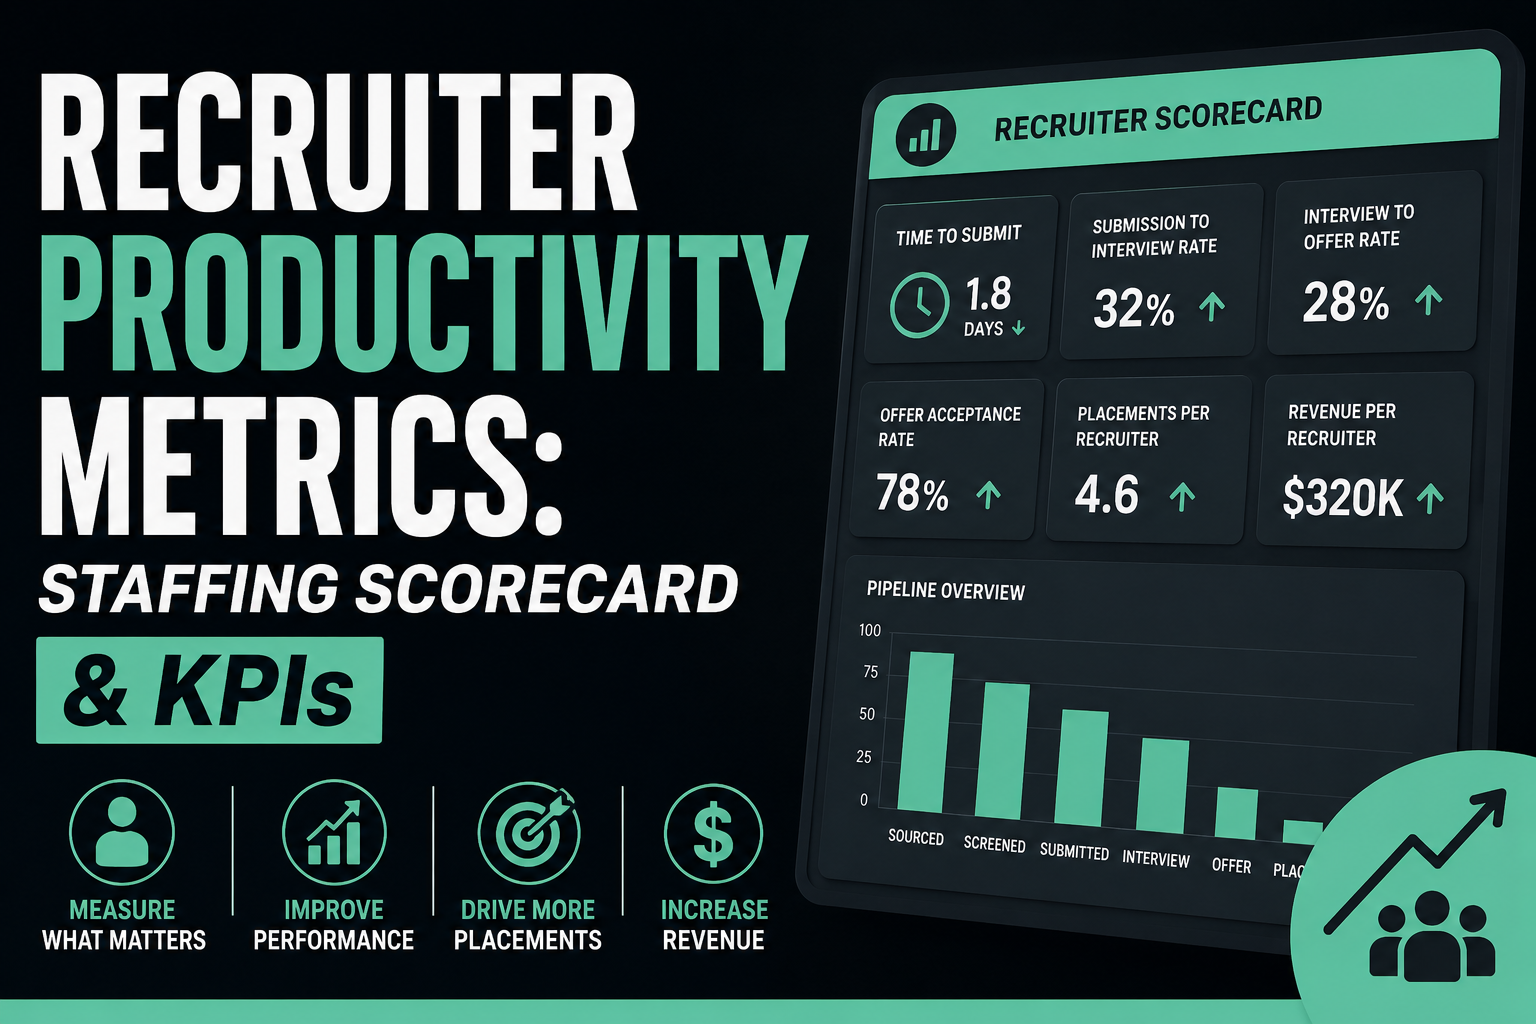
The metrics below function as inputs into the forecast rather than performance measures on their own, which is the distinction worth holding onto as you review them. For deeper detail on how to use these metrics to manage recruiter output day to day, that is better covered in a dedicated look at recruiter productivity metrics.
- Active requisitions
- New job orders
- Qualified candidates
- Submissions
- Submission-to-interview rate
- Interview-to-offer rate
- Offer-to-placement rate
- Time to fill
- Stage aging
- Weighted placements
- Forecasted revenue
- Forecast accuracy
- Pipeline coverage
Each of these feeds directly into one of the formulas or steps covered earlier. Submission-to-interview and interview-to-offer rates are the stage conversion numbers the forecast depends on. Stage aging is what tells you whether an opportunity's original probability still applies. Forecast accuracy is what tells you, over time, whether your assumptions need recalibrating.
How AI Can Improve Recruitment Forecasting
The practical value of AI in this context is not prediction certainty, it is better visibility into the signals a forecast already depends on. Applied well, AI can help staffing teams identify which jobs are most likely to close based on current pipeline movement, which candidates are actually progressing versus stalling, which requisitions are aging without meaningful activity, which pipelines are under-covered relative to target, which opportunities show risk signals such as slowed response times, where historical conversion assumptions no longer match current pipeline behavior, and which jobs need direct recruiter attention right now rather than next week.
None of this replaces the judgment behind the forecast. AI should improve the signal behind the forecast, not turn an uncertain pipeline into a fake certainty. Where it earns its place is in surfacing patterns across a large pipeline faster than a person scanning spreadsheets could, so that recruiter attention and leadership review time go toward the opportunities and gaps that actually matter that week.
Turn Recruiting Data Into a Forecast You Can Act On
A forecast is only as useful as the recruiting work behind it is visible. If sourcing, outreach, and screening are eating recruiter time that should be going toward moving late-stage opportunities forward, the pipeline data feeding your forecast will always be thinner than it could be.
Ninjahire helps staffing teams automate sourcing, outreach, and screening, so recruiters can spend more of their time on the opportunities that actually need human judgment, the ones sitting in your Tier 1 and Tier 2 pipeline right now.
Explore Ninjahire
When Should a Staffing Agency Use Forecasting Software?
Spreadsheets work fine for a single desk with a manageable number of open requisitions and a leader who has time to update the model by hand each week. The limits show up as volume grows, as more desks and recruiters need visibility into the same numbers, or as the manual work of pulling data from an ATS into a spreadsheet starts eating into time that should go toward the pipeline itself.
When evaluating dedicated forecasting or staffing agency productivity tools, a practical checklist helps separate genuine capability from marketing language.
| Capability |
Why It Matters |
| ATS or CRM integration | Reduces manual data collection |
| Pipeline visibility | Shows current forecast inputs |
| Stage weighting | Helps estimate placement probability |
| Historical conversion | Grounds assumptions in actual performance |
| Forecast scenarios | Supports planning under uncertainty |
| Revenue forecasting | Connects placements to financial outcomes |
| Forecast accuracy tracking | Helps improve the model over time |
| Alerts | Flags at-risk opportunities |
| Recruiter-level visibility | Shows where attention may be needed |
If most of these boxes are already checked by a spreadsheet a capable operations lead maintains, there is no urgent need to replace it. The decision point tends to arrive when the manual process itself becomes the bottleneck, not before.
Frequently Asked Questions
What is recruitment forecasting?
Recruitment forecasting is the practice of estimating future recruiting outcomes, such as placements, fills, or revenue, using current pipeline data combined with historical performance. Instead of only reporting how many requisitions are open, it estimates how many of those requisitions are likely to convert into placements within a given timeframe, based on stage conversion, probability, and timing.
How do you forecast placements in a staffing agency?
You forecast placements by segmenting the active pipeline into stages, applying historical conversion rates for comparable roles to each stage, and then adjusting for timing so only opportunities realistically able to close within the forecast period are counted. Each opportunity is assigned a probability, and those probabilities are summed to produce a weighted placement forecast rather than a simple count of open jobs.
What data is needed for recruitment forecasting?
An accurate forecast needs historical data such as past placements, time to fill, and conversion rates by stage; current pipeline data such as active requisitions, submissions, interviews, and offers; timing data such as days in stage and expected start dates; commercial data such as fee or billing rate; and recruiter capacity data to confirm the pipeline can actually be worked.
How accurate is recruitment forecasting?
Accuracy depends on pipeline maturity, the quality of historical data, how consistent the roles and desks are, and how far out the forecast reaches. Near-term forecasts, such as opportunities expected to close within days or weeks, tend to carry higher confidence than a full quarter-end forecast, and long-range forecasts carry the most uncertainty. There is no universal accuracy percentage that applies across every staffing agency.
How often should a staffing agency update its recruitment forecast?
Most active staffing pipelines benefit from a regular review cadence, with many agencies finding a weekly forecast check useful during an open quarter. Beyond a fixed schedule, the forecast should also be updated whenever a material pipeline event occurs, such as a new job order, an offer, a withdrawal, a start date change, or a client cancellation.
A useful recruitment forecast is not a guess about how many jobs happen to be open. It is a structured estimate built from pipeline quality, historical conversion, stage probability, timing, expected placements, and the commercial value attached to each one. That structure is what separates a forecast a finance team can plan around from a pipeline report that only describes what already exists.
The question a staffing leader actually needs answered at quarter end has not changed: how many placements are realistically likely to close, and what are they worth. Getting a reliable answer depends less on a more complicated formula and more on disciplined data, honest probability, and a forecast that gets revisited as often as the pipeline itself changes.
None of that discipline is possible if recruiters are spending most of their week on sourcing, outreach, and initial screening instead of moving the opportunities that actually drive the forecast. That is the operational gap Ninjahire is built to close, giving recruiting teams the automation to handle that volume of work so more attention goes toward the pipeline that determines whether the quarter closes on target.
.png)